Metrics #
In Overtracking’s Metrics section, you have all the information you need to analyze and improve your website’s performance. These metrics are crucial not only for your page’s load speed but also for the overall user experience. In this guide, we help you interpret each metric, understand its importance, and optimize it to ensure a fast, smooth, and efficient website.
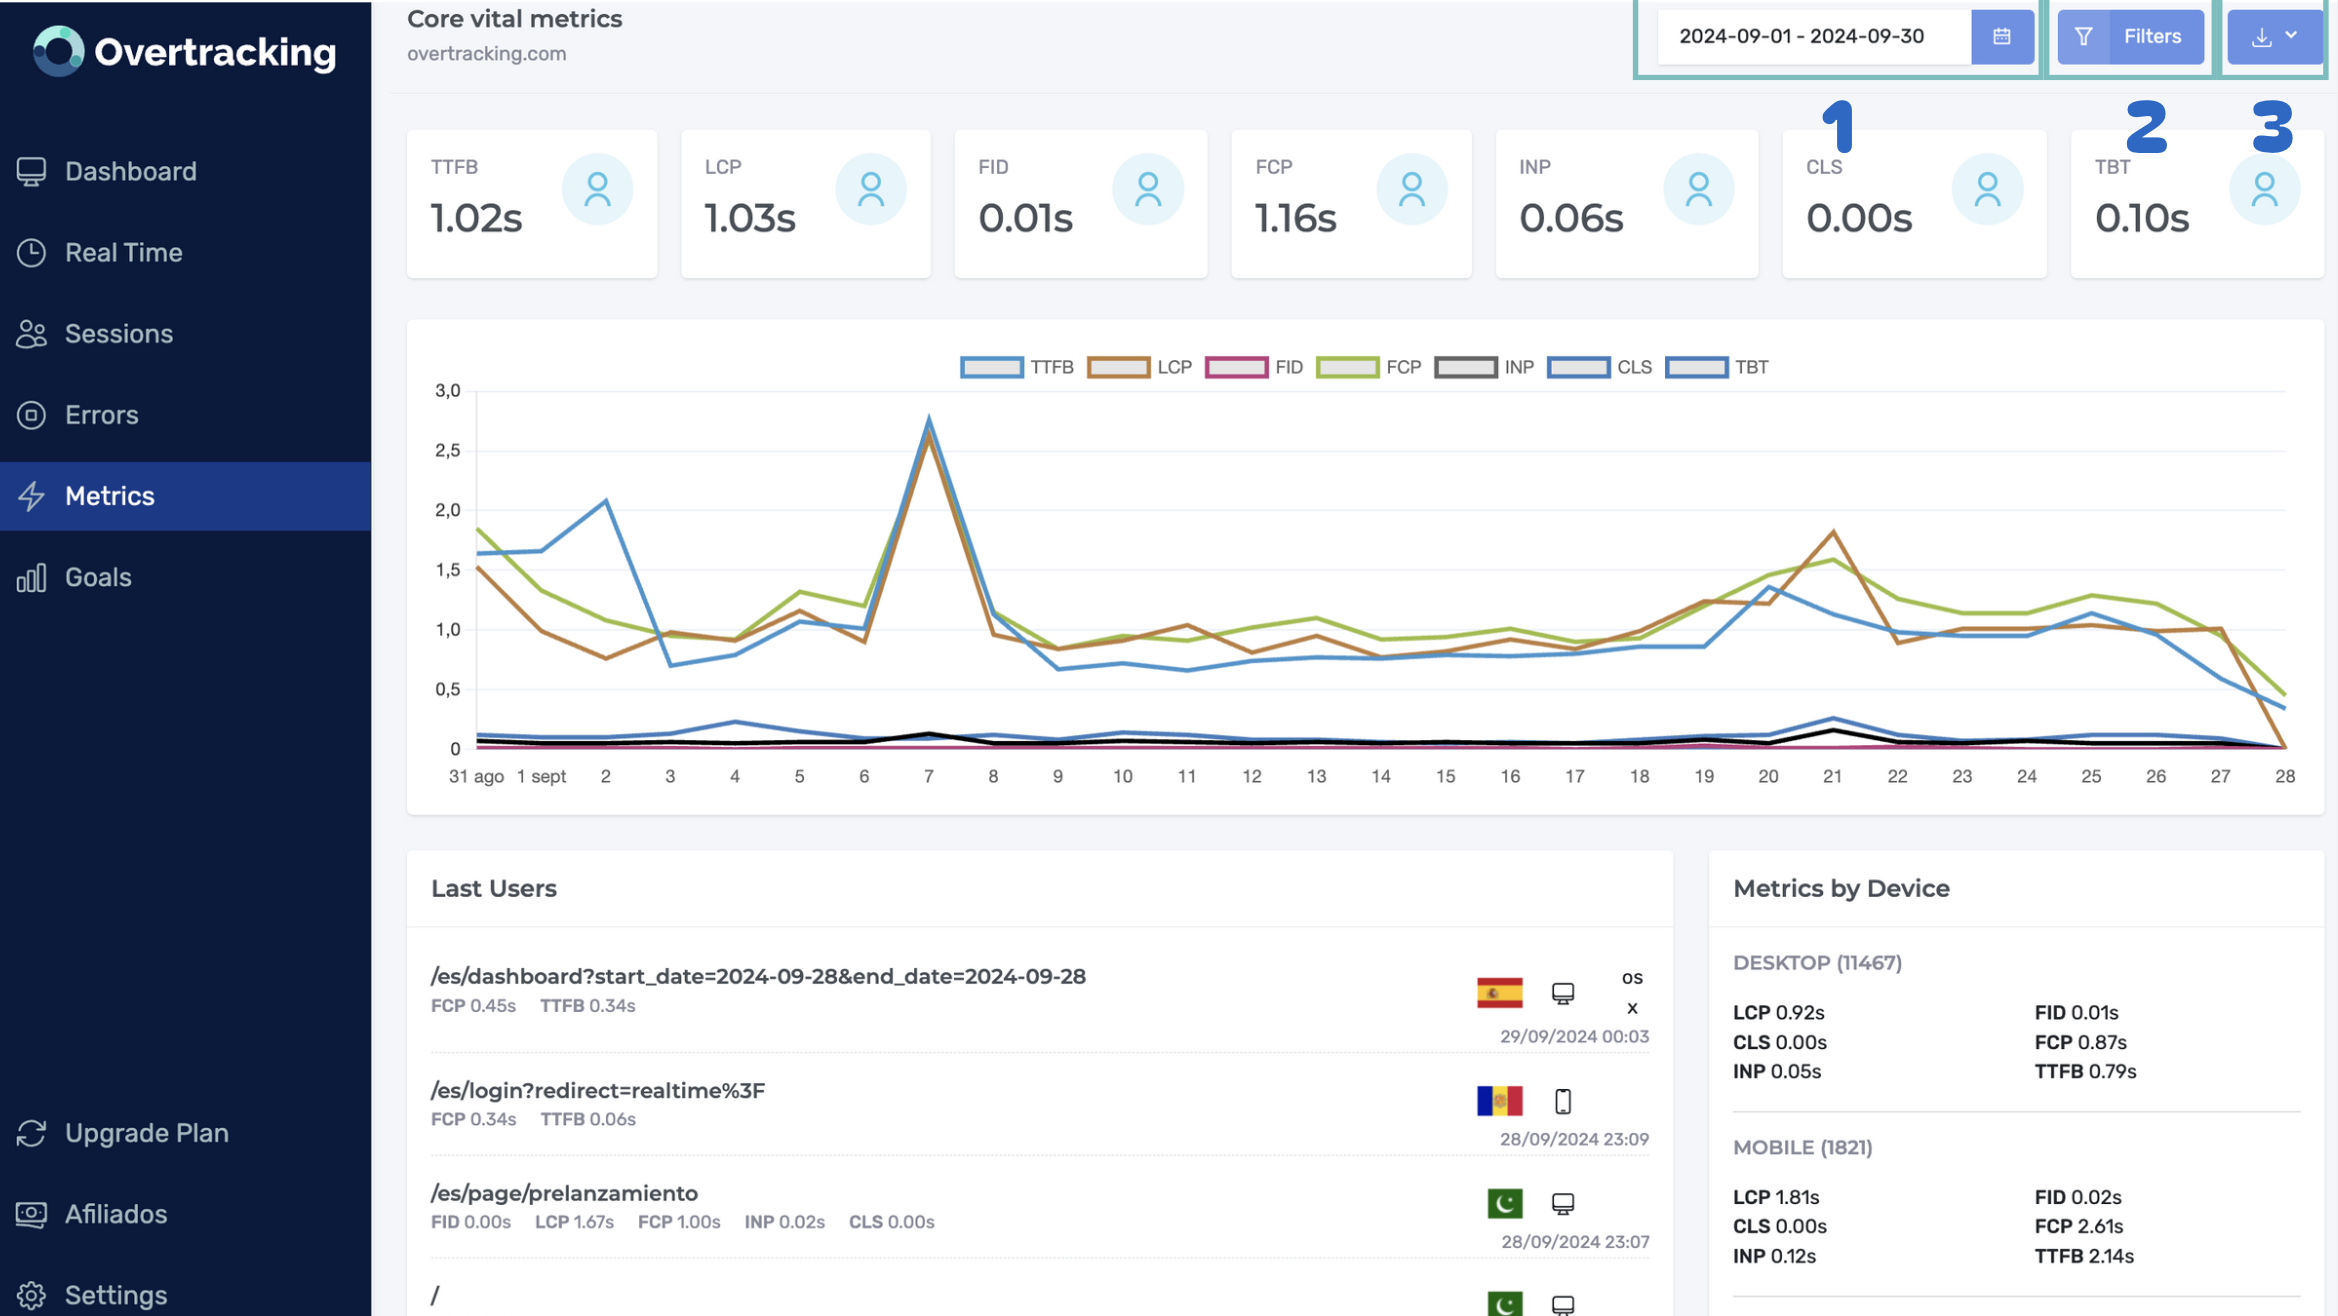
As in other sections, you can change the default selected period (1), add filters by country, device, path, or metric (2), or export data (3) in .csv or .pdf format.
Core Web Vitals chart #
The Core Web Vitals (CWV) chart shows you the daily evolution of the key metrics that Google uses to evaluate user experience on your site. This set of metrics focuses on load speed, interactivity, and visual stability of your site. These are the main metrics we monitor:
- TTFB (Time to First Byte): Measures the time it takes for the server to send the first byte of data to the user’s browser. A low TTFB is essential for users to receive a quick response from your server.
- LCP (Largest Contentful Paint): This metric measures the time it takes to display the largest content element on the page, such as an image or text block. A fast LCP improves the user’s first impression of your site.
- FID (First Input Delay): Measures the time it takes for the browser to respond to the user’s first interaction (such as a click). A low FID is crucial for ensuring an interactive experience and preventing drop-offs.
- FCP (First Contentful Paint): Indicates the time it takes for the first meaningful content on the page to be displayed (such as a logo or text). A fast FCP helps users avoid perceiving the page as “empty” for too long.
- INP (Input Responsiveness): Evaluates the responsiveness of the browser to user interactions in general. A low INP means the user experiences a smooth interaction with the page.
- CLS (Cumulative Layout Shift): Measures the amount of unexpected movement of elements on the page during loading. A low CLS means elements don’t “jump” while the user is trying to interact with the page.
- TBT (Total Blocking Time): Indicates how long the browser was blocked and unable to respond to user interactions. A low TBT ensures that the page quickly responds to user actions.
Core Web Vitals averages table by device #
The CWV averages table by device gives you a clear view of how users experience your website from different platforms: desktop, mobile, and tablets. Since each device type varies in power, connection speed, and screen size, it’s common to see differences in performance metrics. By comparing these metrics, you can identify specific areas of improvement for each device type and optimize the user experience across all platforms.
Examples of device-specific analysis: #
- Higher LCP on mobile: If metrics show that LCP (Largest Contentful Paint) is significantly higher on mobile than on desktop, it may indicate that your images or videos are not optimized for mobile devices. In this case, it’s advisable to reduce image size or implement lazy loading to improve load time.
- High FID on tablets: If the FID (First Input Delay) metric is high on tablets, it might mean there is too much JavaScript running on the main thread, causing delays in responsiveness. Reducing JavaScript and optimizing its execution will improve this metric.
Core Web Vitals averages table by country #
This table helps you understand how your website’s performance varies across different geographic locations. Factors like internet infrastructure, connection speed, and content translations can affect CWV metrics in each country.
Examples of country-specific analysis: #
- High TTFB in a specific region: If you detect that TTFB (Time to First Byte) is high in a particular country, it might indicate that your content delivery network (CDN) is not working properly in that region. This negatively affects the initial load speed and is a key aspect to optimize.
- High CLS in countries with different languages: If CLS (Cumulative Layout Shift) is elevated in a country where a different language is spoken, it might indicate that translations are not well optimized or that the content doesn’t have an adapted layout, causing unexpected shifts during loading.
Recommended limits and tips for improving CWV #
Core Web Vitals are the essential metrics you should monitor to enhance user experience. Below, we detail each one and provide practical suggestions for optimizing them.
TTFB (Time to First Byte) #
- Recommended value: Less than 200 ms (milliseconds).
- Too high: More than 600 ms can be problematic.
- How to improve TTFB:
- Optimize your server code to respond more quickly.
- Use a CDN (Content Delivery Network) to reduce the distance between your server and users.
- Consider migrating to a faster server or upgrading the current one.
LCP (Largest Contentful Paint) #
- Recommended value: Less than 2.5 seconds.
- Too high: More than 4 seconds can negatively impact user experience.
- How to improve LCP:
- Optimize image sizes by compressing them or using lighter formats (such as WebP).
- Implement lazy loading to delay loading elements outside the user’s initial view.
- Minimize JavaScript and CSS that block rendering.
FID (First Input Delay) #
- Recommended value: Less than 100 ms.
- Too High: More than 300 ms can cause frustration, as the page may seem unresponsive.
- How to improve FID:
- Minimize JavaScript use on the main browser thread.
- Use techniques like code splitting to load only the necessary JavaScript for the first interaction.
- Avoid overusing polyfills that may slow down the page.
FCP (First Contentful Paint) #
- Recommended value: Less than 1.8 seconds.
- Too high: More than 3 seconds can be considered slow, as the user takes longer to see the initial content.
- How to improve FCP:
- Minimize the size of HTML, CSS, and JavaScript loaded initially.
- Use lighter image formats and load images efficiently.
- Implement optimized web fonts or use system fonts to reduce initial load time.
INP (Input Responsiveness) #
- Recommended value: Less than 200 ms.
- Too High: More than 500 ms suggests the page is slow to respond to interactions.
- How to improve INP:
- Reduce JavaScript running on the main thread.
- Implement lazy loading for scripts and secondary elements.
- Optimize polyfills that slow down the page.
CLS (Cumulative Layout Shift) #
- Recommended value: Less than 0.1.
- Too high: More than 0.25 indicates that page elements are shifting too much.
- How to improve CLS:
- Ensure space is reserved for images and ads using fixed or proportional dimensions in CSS.
- Avoid loading fonts that cause content reflow. Use
font-display: swapto avoid abrupt changes. - Minimize scripts and CSS loaded asynchronously that affect page layout.
TBT (Total Blocking Time) #
- Recommended value: Less than 300 ms.
- Too high: More than 600 ms can make the page feel heavy and unresponsive.
- How to improve TBT:
- Reduce the amount of JavaScript running on the main thread.
- Implement minification and compression for your CSS and JavaScript files.
- Use a CDN to improve server performance and file delivery.
These are just some examples of issues that could be causing high scores in your site’s key metrics and some general tips to improve them. However, the problem might come from elsewhere. If you identify any of these metrics as significantly high, we recommend monitoring and studying them in-depth to determine what is causing the issues and resolve them as soon as possible.