Dashboard #
The Overtracking Dashboard provides an overview of your website’s performance. In this tutorial, we will guide you through each of the available metrics and features so you can make the most of the information it provides.
Key metrics #
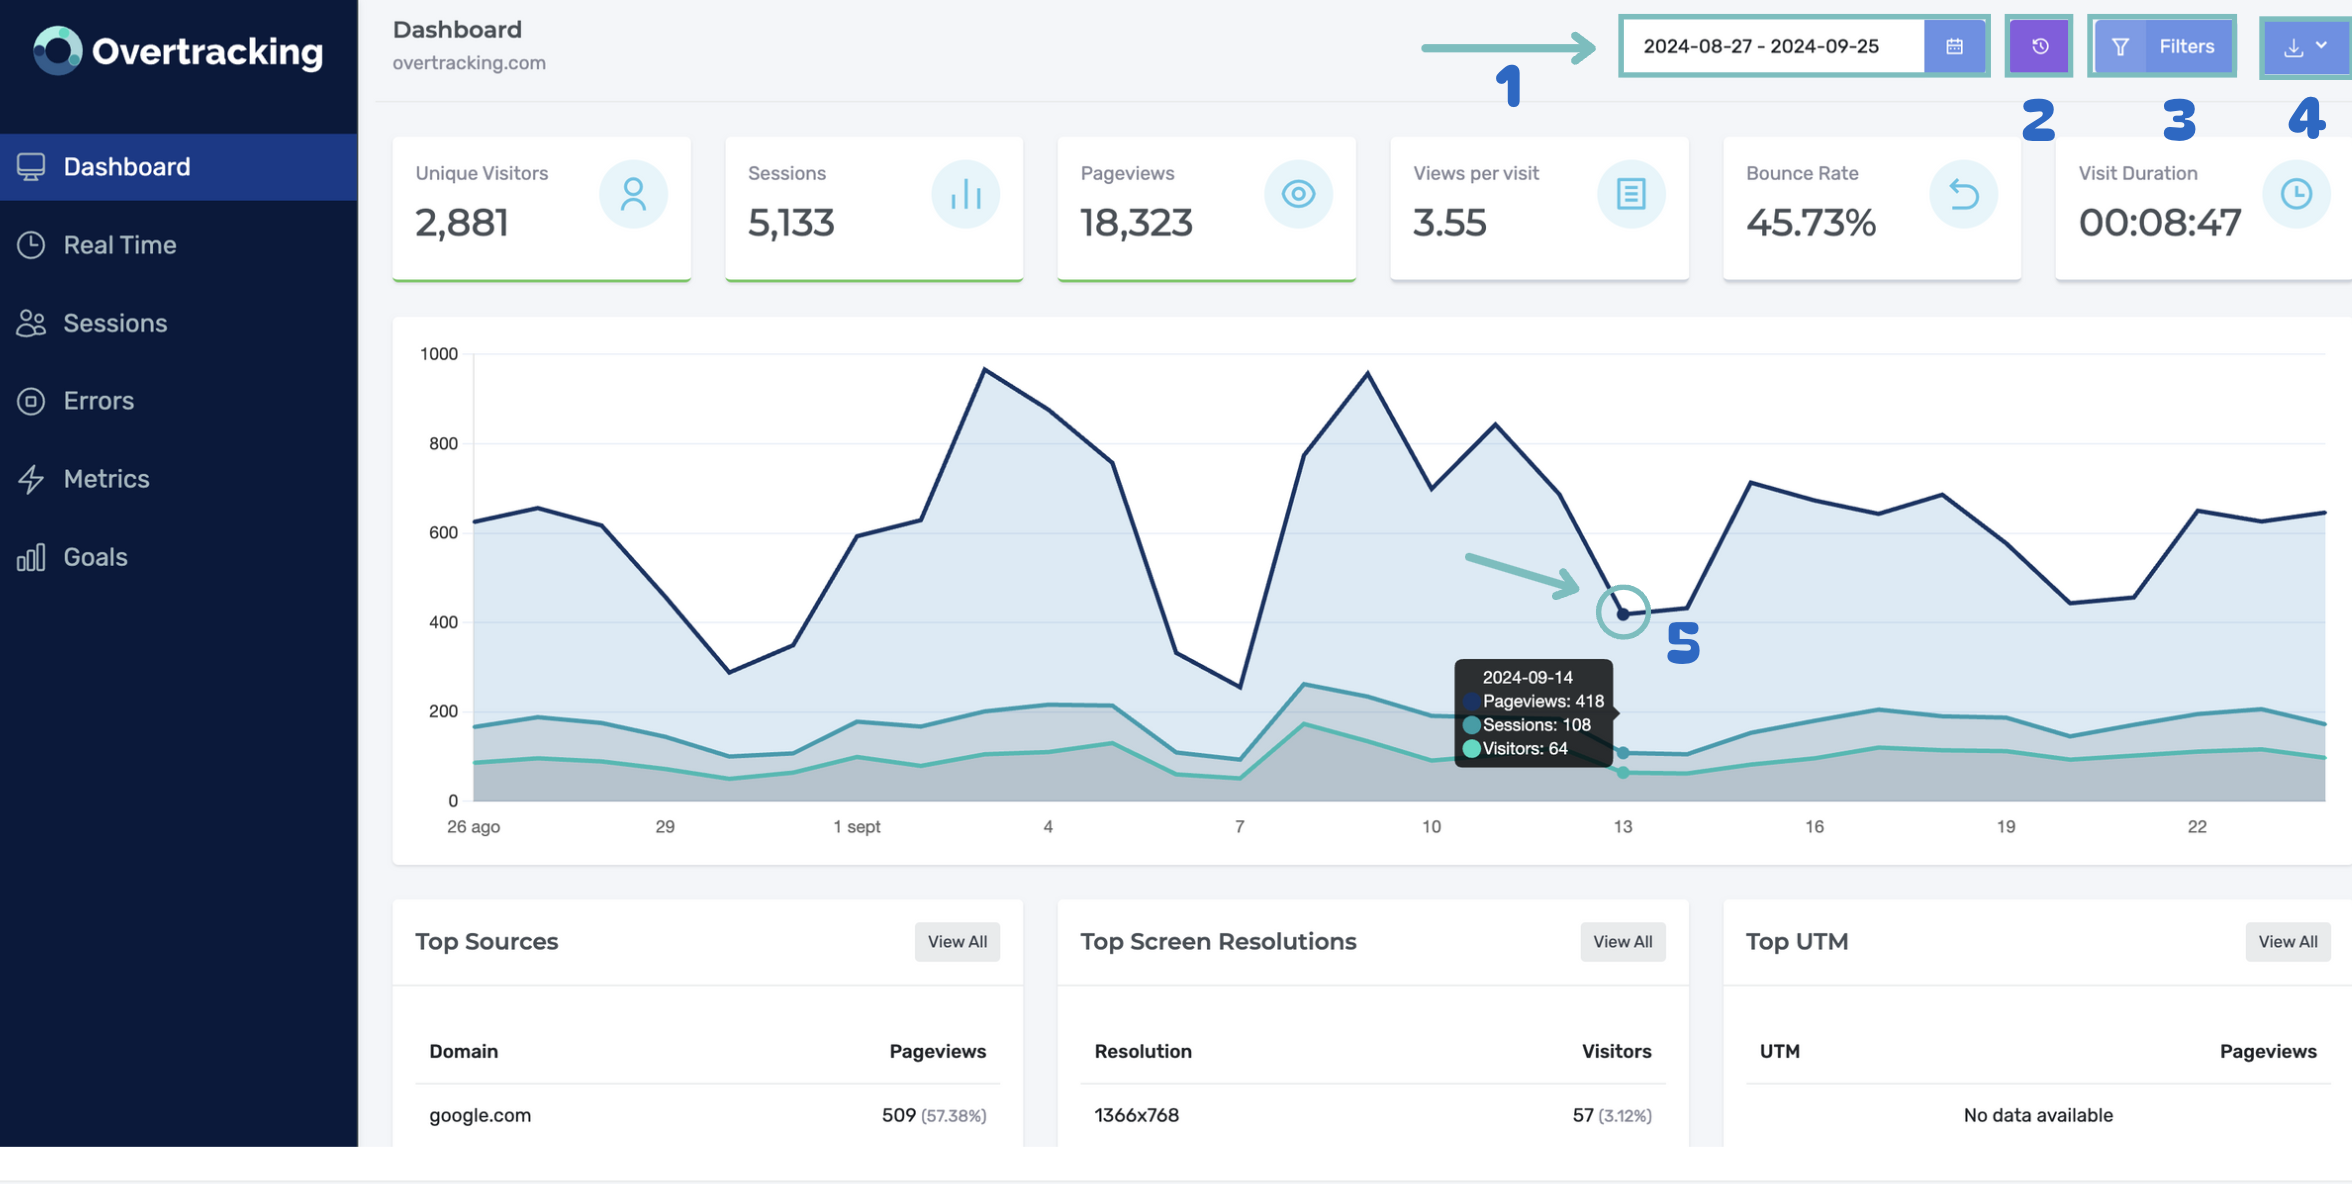
When accessing the Dashboard, you will see the following metrics:
- Unique Visitors: This is the number of distinct users who visited your website during the selected period.
- Sessions: The number of times users accessed your website during a given period, i.e., the number of visits your website received.
- Page Views: The total number of pages viewed by users during the selected period.
- Pages per Visit: The average number of pages a user viewed during a session.
- Bounce Rate: The percentage of users who leave your website after viewing just one page.
- Visit Duration: The average time users spend on your website during a session.
- Period Selection
- Period Comparison
- Filters
- Export Files
- Detailed View
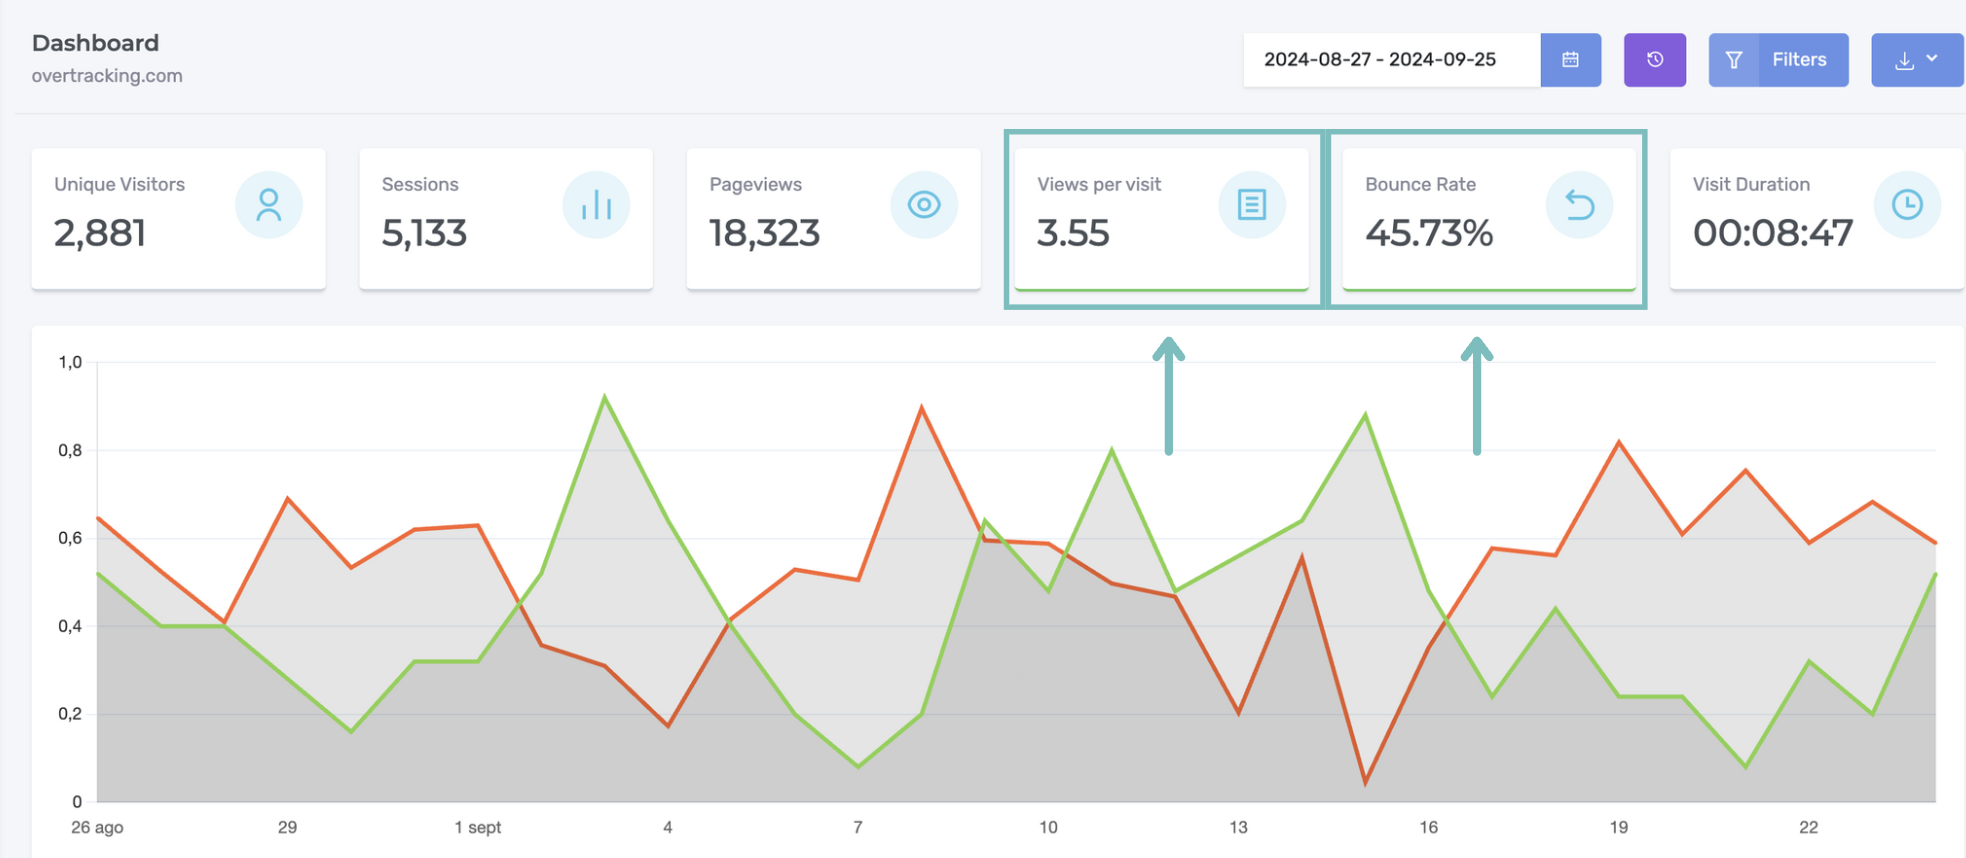
You can click on the top boxes where the metrics are displayed to choose which ones you want to show in the graph for a clearer view of the data. As you can see in the image, those with the green shading at the bottom are the ones that are selected and will appear in the graph.
Charts and period comparison #
Below the key metrics, you’ll find a chart that shows the progression of page views, sessions, and users over a predefined period of one month. You can adjust this period to analyze specific data, such as a day, a week, a year, or any other custom period. Additionally, you can compare two different periods to observe changes in your website’s performance.
To select the period you want to view, click on the default date (1), choose the period, and click apply.
To compare periods (2), first select the period (1) you want to compare, then click on the purple button and select, for example, the previous period. If you select, for instance, “last 30 days,” and then choose “previous period,” it will compare the last 30 days with the 30 days before that.
Example: You select (1) from August 22 to September 20, and then compare (2) with the previous period, from August 21 to July 23.
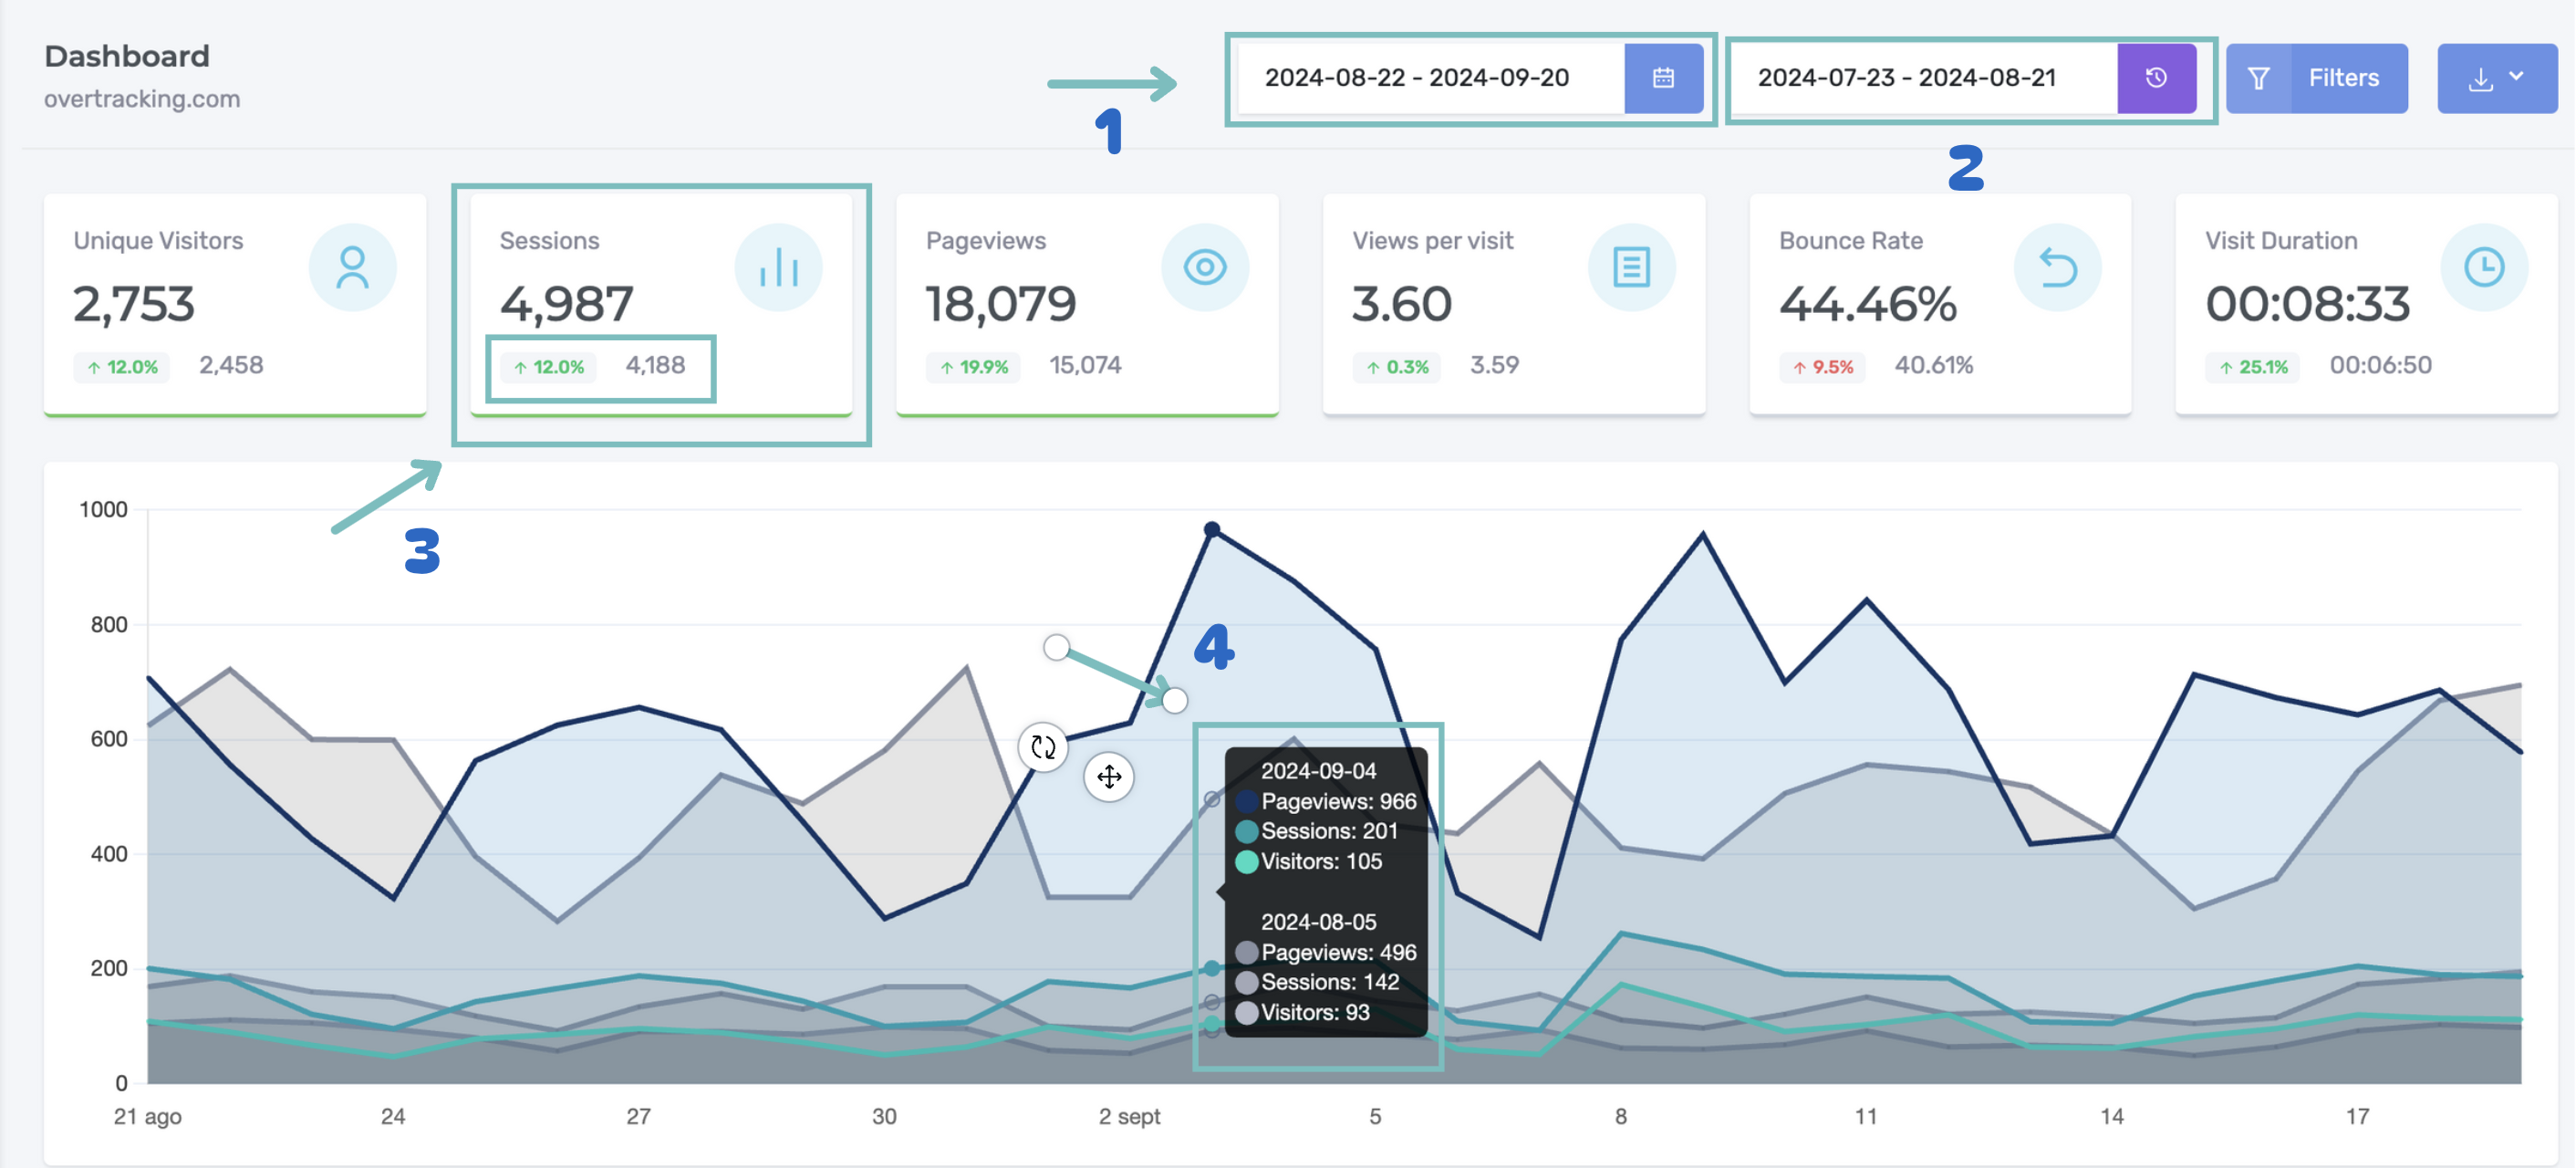
When comparing periods, new data will appear below the metrics (3), showing whether they have improved or worsened.
If you want to see detailed data for a specific day, just hover your cursor over the day on the timeline in the chart (4).
Adding filters #
The Overtracking Dashboard allows you to apply filters to the chart and metrics below to obtain specific information about your website. Experiment with different filters to gain insights into your users’ behavior. You can filter by:
- Metrics: Select the metric you want to view (for example, country, city, device, language, path, UTM campaign source, etc.).
- Condition: Select the condition you want to apply to the filter (for example, equals, does not equal, contains, does not contain, greater than, less than).
- Value: Enter the value you want to filter by.
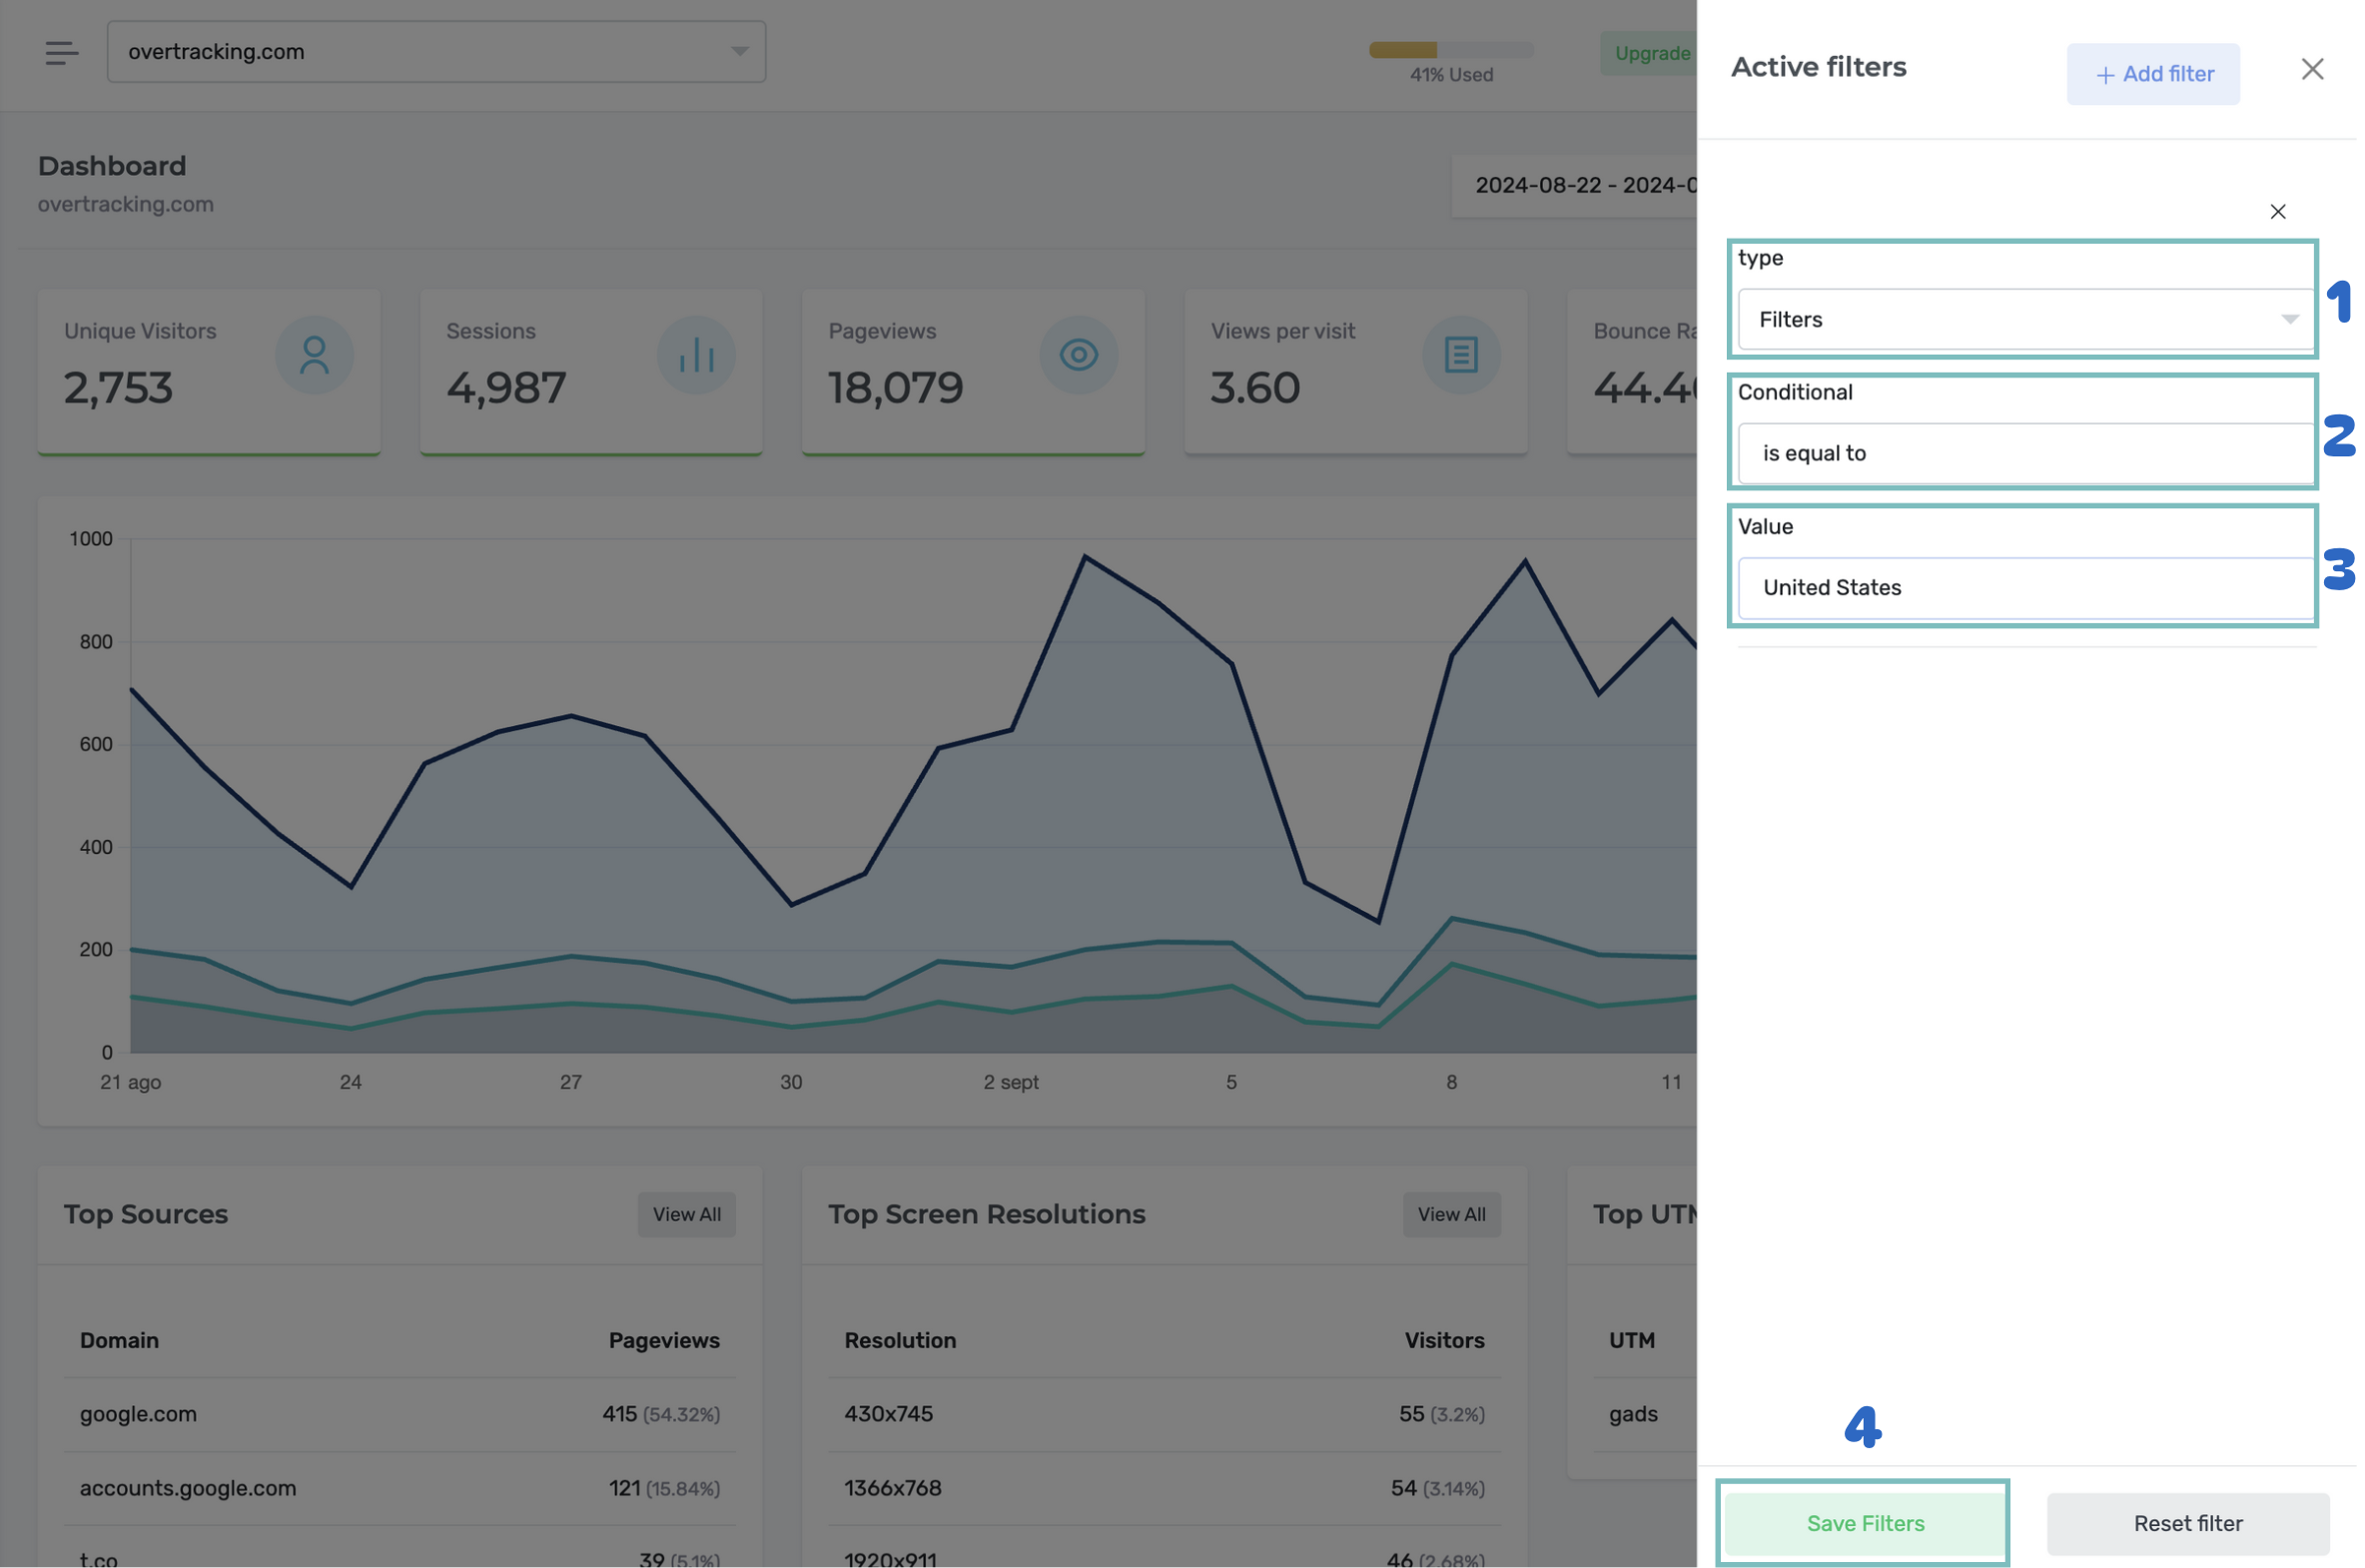
To add a filter, click the filter button in the upper right corner, fill in the type, condition, and value you want to filter by and save the filters.
Here are some examples: #
- Show only data from visits to the homepage:
- Filter: Path
- Condition: Equals
- Value: /(homepage URL)
- Show only sessions from users in Spain:
- Filter: Country
- Condition: Equals
- Value: Spain
- Show only views containing the word “product”:
- Filter: Path
- Condition: Contains
- Value: /product
- Show only data from visits from users coming from YouTube:
- Filter: Referrer
- Condition: Contains / Equals
- Value: YouTube
Combining filters #
You can combine multiple filters to get a more precise view of your data. For example, you can display only page views of the homepage from users in Spain using a tablet.
To do this, add the first filter as explained in the previous step. Click the Filters button (1), which will now appear in green with the number of filters applied. Click the “add filter” button again (2), fill in the new data as in the previous example, and save the filters (3).
You can keep combining as many filters as needed.
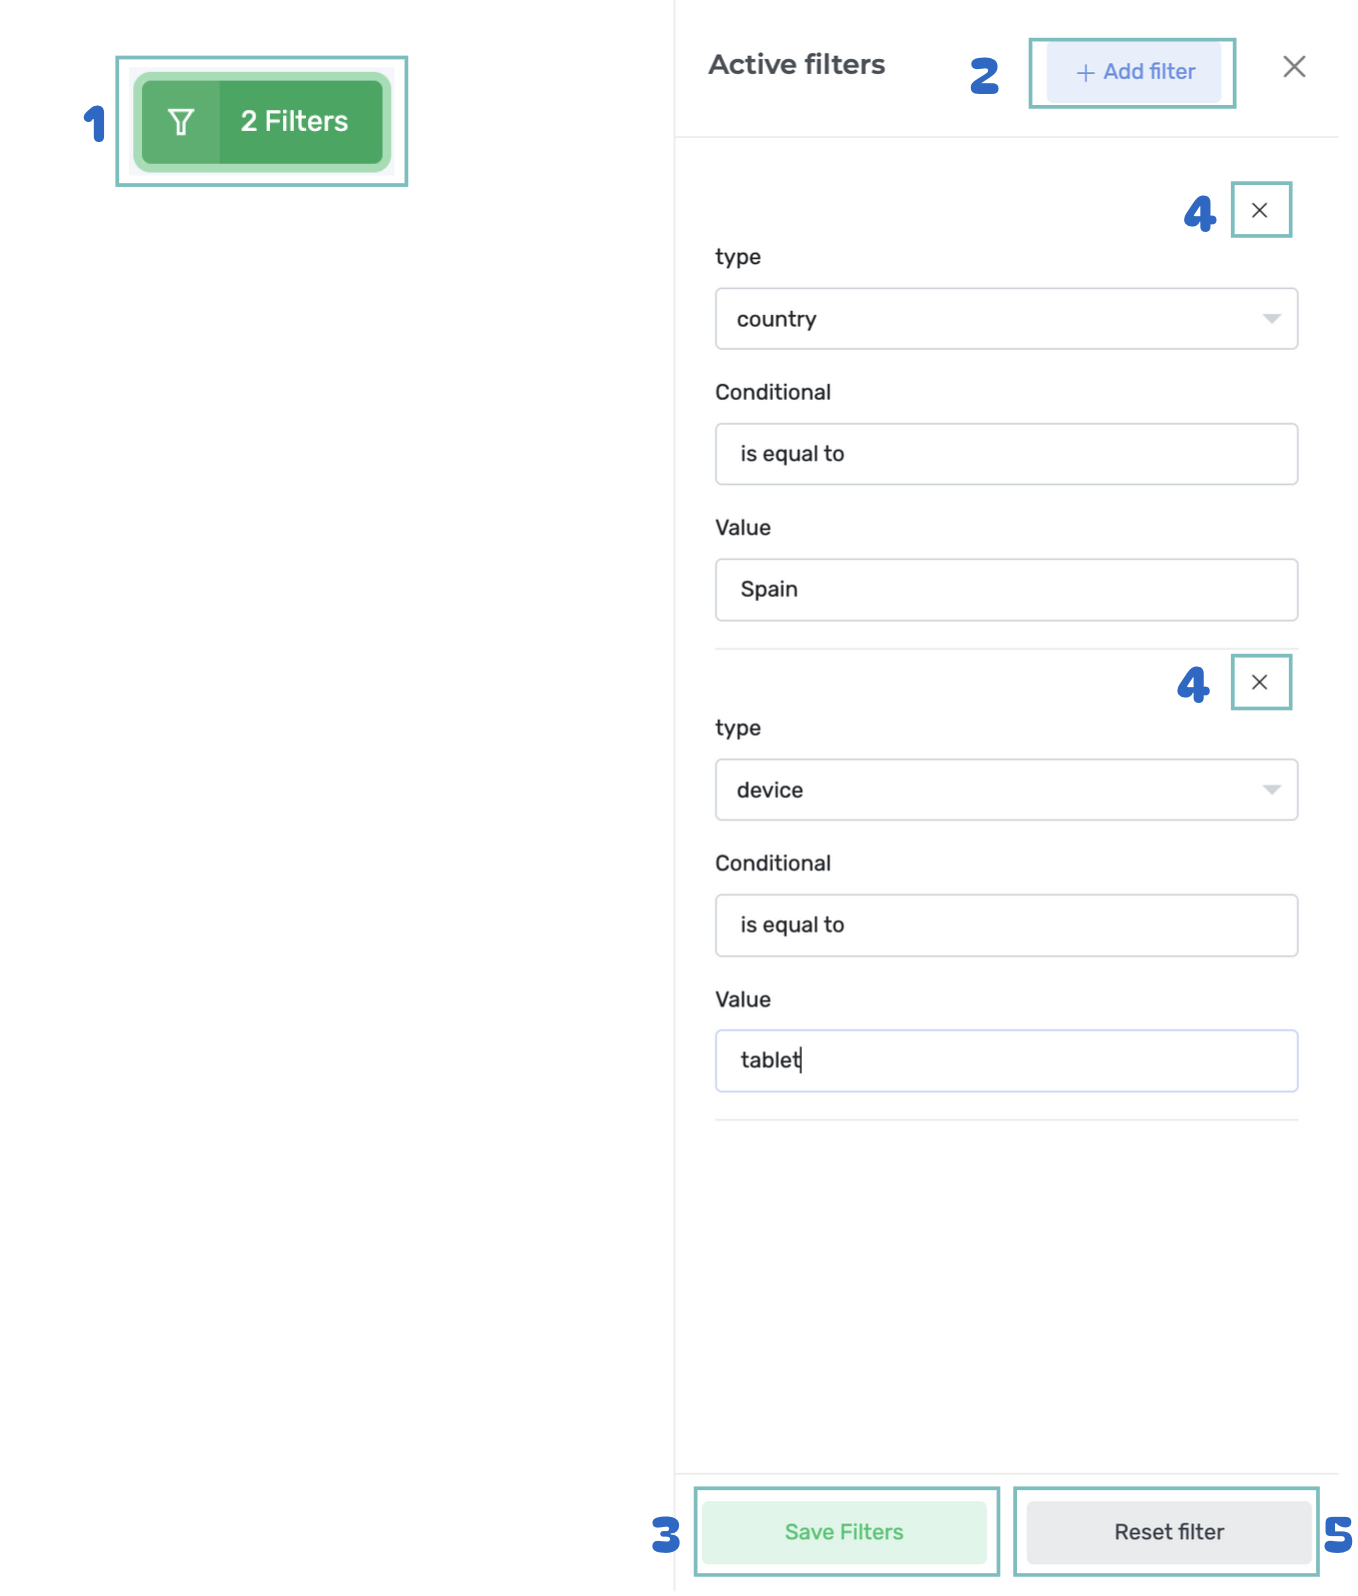
Removing filters #
There are two ways to remove filters: either by clicking the X in the upper right corner of each filter (4) or by clicking “reset filters” (5). If you want to remove all filters, clicking the “reset filters” button (5) is the fastest option.
If you only want to remove one filter while keeping the others, click the X on the filter you want to delete (4).
Exporting data #
The Overtracking Dashboard allows you to export and share your website’s data in two formats:
- CSV: A comma-separated values file format that you can open in a spreadsheet program like Excel, Numbers, or Google Sheets.
- PDF: A non-editable file format that is easy to share and print.
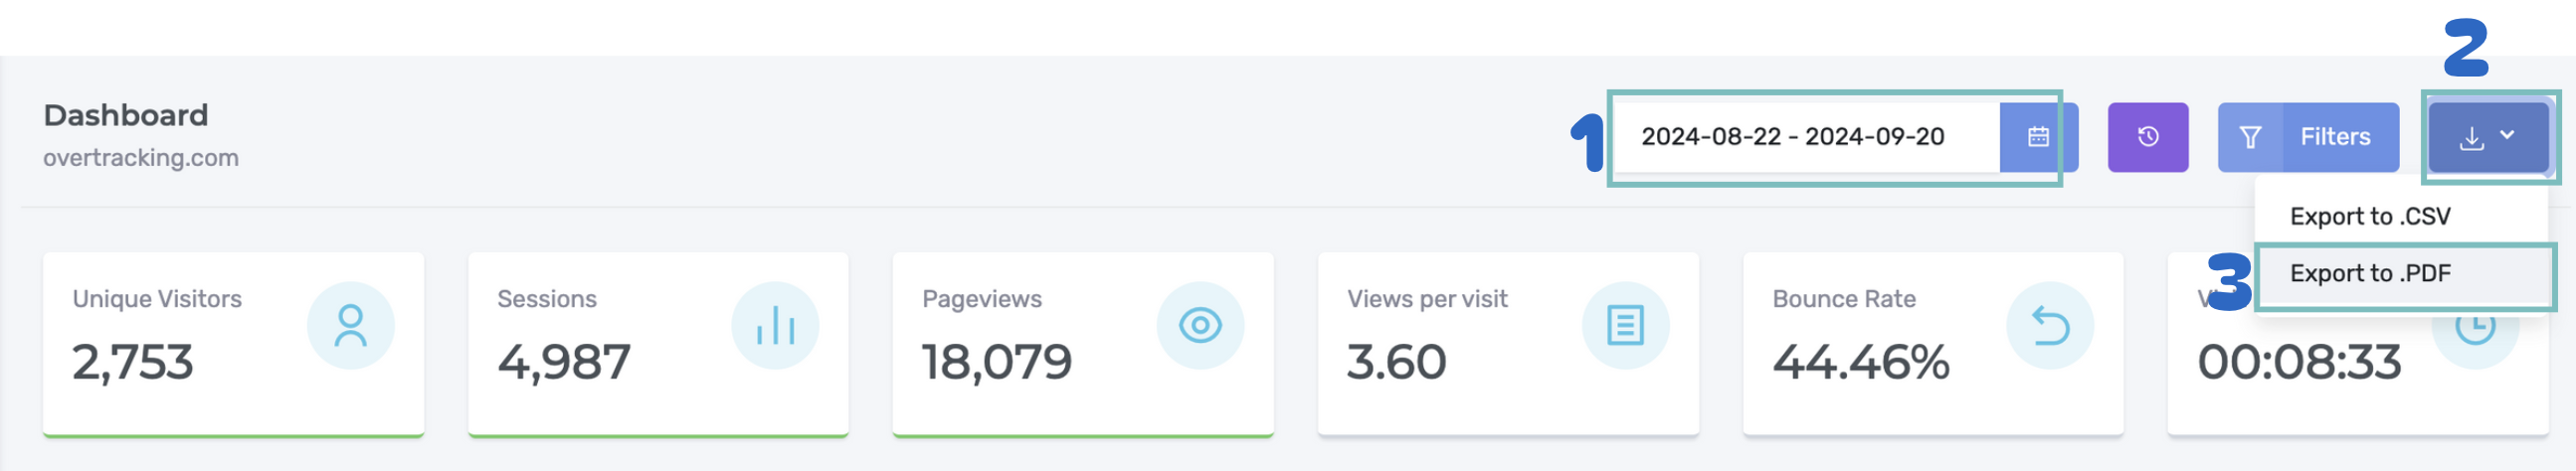
To export the data, first select the period you want to export (1), then click the export button (2) and choose the format in which you want to export (3).
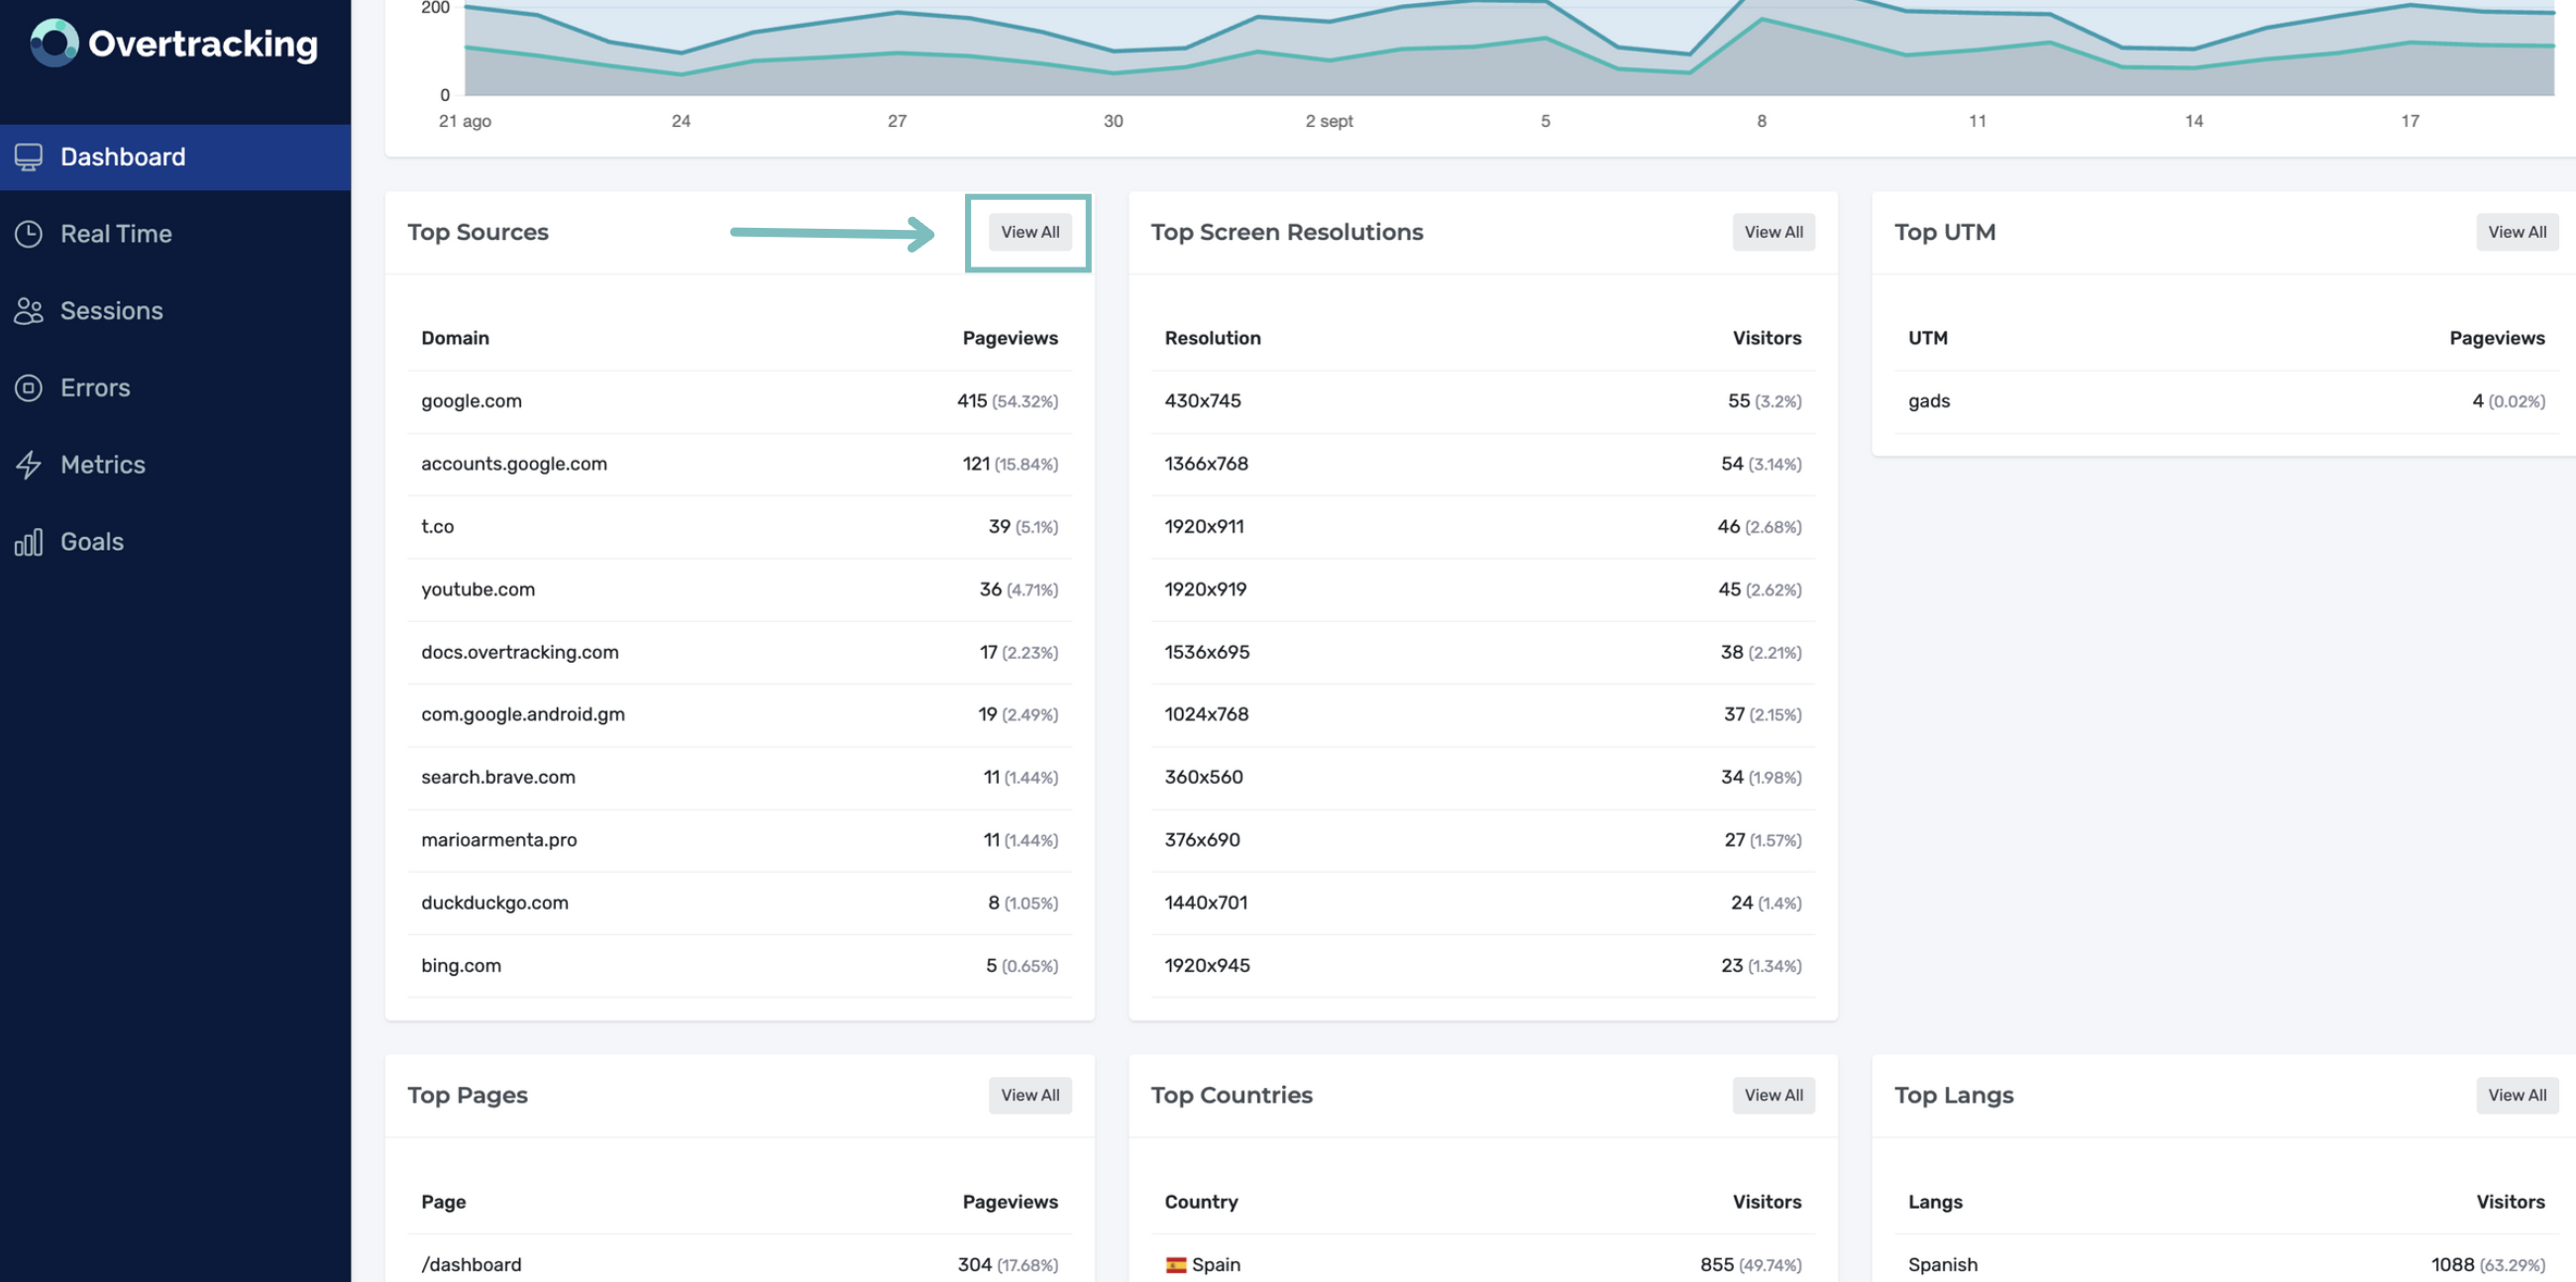
Detailed information #
In the lower section of the Dashboard, detailed information is presented about:
- Pages: The pages of your website that received the most visits.
- Sources: The channels that generated the most traffic to your website (for example, organic search, social media, etc.).
- Countries: The countries your visitors are from.
- Operating Systems: The operating systems your visitors use.
- Devices: The devices your visitors use (for example, computers, tablets, smartphones).
- Browsers: The browsers your visitors use to reach your website.
- Browser Language: The language of your visitors’ browsers.
- Screen Resolutions: The most common screen resolutions your visitors use, helping you decide if you should adapt your site to the most common resolution.
- UTM Campaigns: The marketing campaigns that generate the most traffic to your website.
- Goals: The number of times your set goals have been completed, as configured in the Goals tab.
By clicking the “View all” button within each category, you can get more detailed information about that specific category.